Week 4: Design Tools
Design Tools
This week we will be looking at the Design section of the Problem Solving Methodology.
If you don’t know what the Problem Solving Methodology is - go to the following link:
Problem Solving Methodology
The Design Section, for Spreadsheets, will look at developing an IPO (Input-Process-Output) and a Mock-Up Diagram, to show the developer and to plan how your database will look, before developing it.
| ipo_mockup.pptx |
Exercise 1: [To be submitted]
Read the following Scenario:
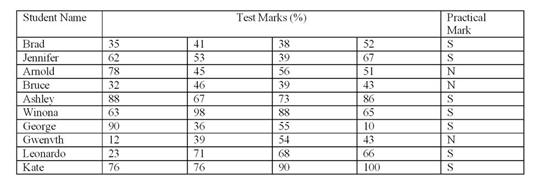
A science teacher gives only two results, Pass or Fail.
A Pass requires a test average of 50% or more AND the satisfactory completion of practical work (S for Satisfactory, N for not satisfactory).
A fail is recorded if either of the two conditions are not met.
Currently, all this is being completed manually, which wastes time.
You have been hired to come up with an electronic solution to the problem.
The following data has been made available.
Answer the following questions
1. What is the purpose of the solution?
2. Develop an IPO chart and a mock up diagram for how you will design your spreadsheet.
Note: There are columns and functions and formulas that you will need to add. This involves you thinking about what the solution is asking for.
Your IPO Chart: Must include 2-3 examples. Us the same format as in the powerpoint file.
Your Mock Up Diagram: This can either be hand drawn or use an appropriate program to create it.
Include the appropriate formulas you will need to use to calculate the Test Average and calculate the Final Mark. Remember to add what you the solution requires!
You do not need to develop the solution as yet, but if it helps, you can hop into excel and play around with formatting and formulas.
4. Save and Submit.
Exercise 2: [To be submitted]
1. Duplicate your Design by creating the solution in Excel or in Piktochart.
Save and Submit.
Save and Submit.
